Monthly Insolvency Statistics July 2024

Published on : 20th August, 2024
Insolvency service logo

The July monthly insolvency statistics have been released. Here we provide a summary overview.

Company Insolvencies

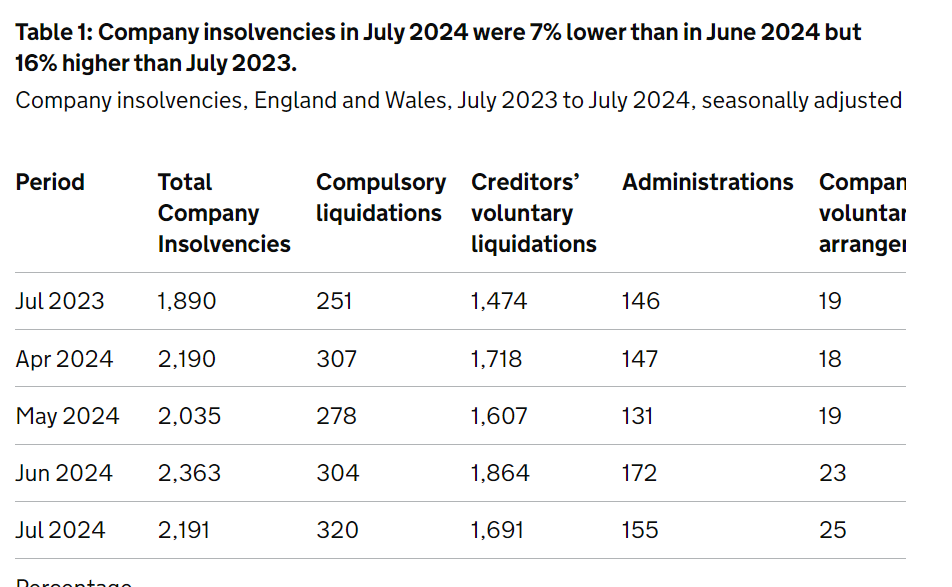
The July 2024 company insolvency statistics for England and Wales showed a total of 2,191 insolvencies, a 16% increase compared to July 2023.

Creditors’ voluntary liquidations (CVLs) remained the most common, comprising 77% of cases.

Compulsory liquidations also saw a rise, reaching their highest level since 2018. Sectors such as construction and retail were notably impacted.

Scotland saw a 21% year-on-year increase in insolvencies, while Northern Ireland’s figures remained stable. The overall trend indicates a gradual increase in insolvency cases across the UK.

Just 25 companies were rescued by using Company Voluntary Arrangements (CVAs) in July.  This is unfortunate as surely it is possible that some of the 1000s of companies that went insolvent last month some might have been able to survive by using a CVA?

CVLs

The number of CVLs decreased by 9% from June 2024 but was 15% higher than during the same month last year (July 2023), after seasonal adjustment.

Compulsory Liquidations

The number of seasonally adjusted compulsory liquidations in July 2024 was the highest monthly number since August 2018, 5% higher than in June 2024 and 27% higher than in July 2023.

In 2023, there were 44% more compulsory liquidations than in 2022, but they were still 4% fewer than in 2019 (before to the pandemic). The numbers have risen from the all-time lows observed in 2020 and 2021, when limitations were placed on the use of winding-up petitions and statutory demands, which resulted in compulsory liquidations.

Administrations

The number of administrations in July 2024 was 10% lower than in June 2024 but 6% higher than in July 2023, after seasonal adjustment.

High profile administrations have been few and far between these last few months with Carpetright being the most noteable exception.

It does seem that In the 12 months to June 2024 compared to the previous 12-month period, insolvencies increased by the most in the hospitality sector.  The increase was c.15%

This is not surprising given that this includes the period of high inflation in the last half of last year.

Written ByRobert Moore

Marketing Manager


+447584583884

Rob has over a decade of experience in web and general marketing. He has extensive knowledge of the Insolvency sector and has helped many worried directors with their questions.

Rob is now working with the Board at RMT KSA to develop strategic marketing programmes to support the business plan and drive more company rescues.

Robert Moore
Insolvency service logo

Monthly Insolvency Statistics: October 2025 Shows Uptick In Compulsory Liquidations

in Research and Statistics

In October 2025, there were 2,029 company insolvencies in England and Wales. The annual number of company insolvencies in the UK for 2024 was 23,872. Individual insolvencies in England and Wales reached 10,552 in October 2025.Company Insolvency Statistics (England and Wales) In October 2025, the number of registered company insolvencies in England and Wales was similar to September 2025 levels but 17% higher than in October 2024. The monthly numbers in the first ten months of 2025 have been slightly higher than in 2024, which followed a 30-year annual high in 2023.The total for October 2025 comprised:1,592 Creditors' Voluntary Liquidations (CVLs) 301 Compulsory Liquidations 119 Administrations 17 Company Voluntary Arrangements (CVAs)In the 12 months ending in October 2025, one in every 187 companies on the effective register entered insolvency. The industries most affected in this period were construction, wholesale and retail trade, and accommodation and food services.Individual Insolvency Statistics (England and Wales) In October 2025, there were 10,552 individual insolvencies, which is a 14% increase compared to October 2024.

Read
Monthly Insolvency Statistics: October 2025 Shows Uptick In Compulsory Liquidations
Insolvency service logo

Monthly Insolvency Statistics: July 2025 Shows Levelling Off Of Liquidations

in Research and Statistics

The number of registered company insolvencies in England and Wales was 2,081 in July 2025, similar to both June 2025 (2,053) and the same month in the previous year (2,078 in July 2024). Monthly company insolvency numbers in the first seven months of 2025 were higher than the second half of 2024, but remained slightly lower than the 30-year annual high seen in 2023.  As such,  there isn't much to say really accept the summer months are alwas a bit volatile as you can see in the peak recorded in May. The insolvency rate of c. 36-37 per 10,000 companies has remained remarkably steady in 2025 down from the peak of 40 seen in spring 2024. The majority of the debts accrued during the pandemic have washed through the system.  So, those who cannot pay their BBLs and CBILS have already been into an insolvency procedure. Further tax rises may dampen consumer spending in the latter part of the year but many companies have been sensible with keeping costs down.It is often in a big boom that more companies go bust due to too much optimism combined with poor financial controls.

Read
Monthly Insolvency Statistics: July 2025 Shows Levelling Off Of Liquidations
Insolvency service logo

Monthly Insolvency Statistics: May 2025 Shows Increase in CVLs

in Research and Statistics

Looking at the graph below it is clear that insolvencies are on the way up, albiet from a low base. ​ Creditors voluntary liquidations are up quite significantly with 200+ more this month than last.  Other insolvencies are low but recent analysis of June's winding up petitions show that the levels are consistent with the uptick since the beginning of the year. CVAs are very low but we are finding that we can get longer time to pay arrangements with creditors and so avoiding any formal appointment.  HMRC are granting longer periods for companies to pay their tax as long as they are viable and compliant.  Get in touch with us if you are worried about cashflow and want to get an HMRC Payment Plan. ​ There were 2,238 company insolvencies in May 2025, 8% higher than in April 2025 and 15% higher than in May 2024. The increase of 8% compared to April 2025 is less than the average absolute change of 12% between consecutive months over the past three years. May 2025 saw a lower number of compulsory liquidations than April 2025, but a higher number of CVLs. ​​Company insolvencies in May 2025 consisted of 354 compulsory liquidations, 1,734 creditors’ voluntary liquidations (CVLs), 136 administrations and 14 company voluntary arrangements (CVAs). There were no receivership appointments. The number of compulsory liquidations was 7% lower than the 10-year high seen in April 2025, but remained higher than both May 2024 and the 2024 monthly average. The number of CVLs in May 2025 was higher than both April 2025 and the 2024 monthly average. Administrations were higher than in April 2025, while CVAs were lower.   ​​​CVLs 77% of all company insolvencies in May 2025 were CVLs. There were 11% more CVLs than in April 2025 and 13% more than in May 2024, the same month the previous year. For the first time since 2020, the annual total of CVLs decreased in 2024. Following three years of growth, the annual total reached its highest point since recording started in 1960 in 2023. CVLs have been increasing at a rate of about 10% annually between 2017 and 2019, but they dropped to their lowest levels since 2007 during the COVID-19 epidemic.Compulsory liquidations In May 2025, there were 32% more compulsory liquidations than in May 2024 and 31% more than the monthly average for 2024, however they were 7% fewer than the 10-year peak recorded in April 2025. Compulsory liquidations rose 14% in 2024 compared to 2023, reaching their highest levels since 2014. In addition to limitations on the use of statutory demands winding-up petitions (which resulted in compulsory liquidations), this continued an increase from record low levels observed in 2020 and 2021. The first five months of 2025 saw an even greater surge in numbers.Administrations The number of administrations in May 2025 was 28% higher than in April 2025 and 12% higher than in May 2024.Company Voluntary Arrangements (CVA) ​The number of CVAs in May 2025 was 42% lower than in April 2025 and 26% lower than in May 2024. Low numbers relative to history. Low volumes prevent seasonal CVA adjustments. There were 9% more CVAs in 2024 than in 2023 and approximately 80% more than in 2022, which had the lowest yearly total since 1993. Despite this increase, 2024's number was just under 60% of the 2015–2019 average.Receivership Appointments No receiverships were appointed in May 2025. Only four receivership appointments were documented in the year ending May 2025 (see Glossary).​Insolvencies by Industry The five industries (in accordance with SIC 2007) that experienced the highest number of insolvencies in the 12 months to April 2025 were: Construction (4,032, 17% of cases with industry captured), Wholesale and retail trade; repair of motor vehicles and motorcycles (3,615, 15% of cases with industry captured), Accommodation and food service activities (3,369, 14% of cases with industry captured), Administrative and support service activities (2,410, 10% of cases with industry captured), and Manufacturing (1,970, 8% of cases with industry captured). Analysts will be looking closely at staff heavy industries such as Leisure and hospitality for any indications of distress following the hikes in Employers NIC.

Read
Monthly Insolvency Statistics: May 2025 Shows Increase in CVLs